Digits Contracts Compared: Over/Under vs Even/Odd vs Matches/Differs
All three Digits contracts predict the last digit of the final tick. They differ in how many digits win, and that sets how likely each one is to win.
Last updated:
Side by side
| Contract | You predict | Digits that win | Your choice |
|---|---|---|---|
| Over/Under | Last digit above or below your digit | Depends on your digit | Over or Under, plus a digit from 0 to 9 |
| Even/Odd | Last digit is even or odd | 5 of 10 | Even or Odd |
| Matches/Differs | Last digit equals your digit or not | 1 of 10 (Matches) or 9 of 10 (Differs) | Matches or Differs, plus a digit |
The three Digits contracts.
The chances of winning
On random synthetic indices the last digit is expected to land on each of 0 to 9 about 10% of the time. Under that assumption, the chance of winning follows directly from how many digits win:
| Contract and choice | Winning digits | Chance |
|---|---|---|
| Over 1 | 2, 3, 4, 5, 6, 7, 8, 9 | 80% |
| Over 4 | 5, 6, 7, 8, 9 | 50% |
| Over 8 | 9 | 10% |
| Under 1 | 0 | 10% |
| Under 5 | 0, 1, 2, 3, 4 | 50% |
| Under 9 | 0 to 8 | 90% |
| Even or Odd | 5 digits each | 50% |
| Matches | Your digit | 10% |
| Differs | Any other digit | 90% |
Chance of winning, assuming each digit has a 10% chance. Payouts are set to reflect these chances. A likelier outcome pays less.
Safer-looking choices pay less
A 90% chance means a small payout, and a loss costs your whole stake. One loss can wipe out several wins. Check drawdown and largest loss in Trade analytics.
Reading Digit analysis
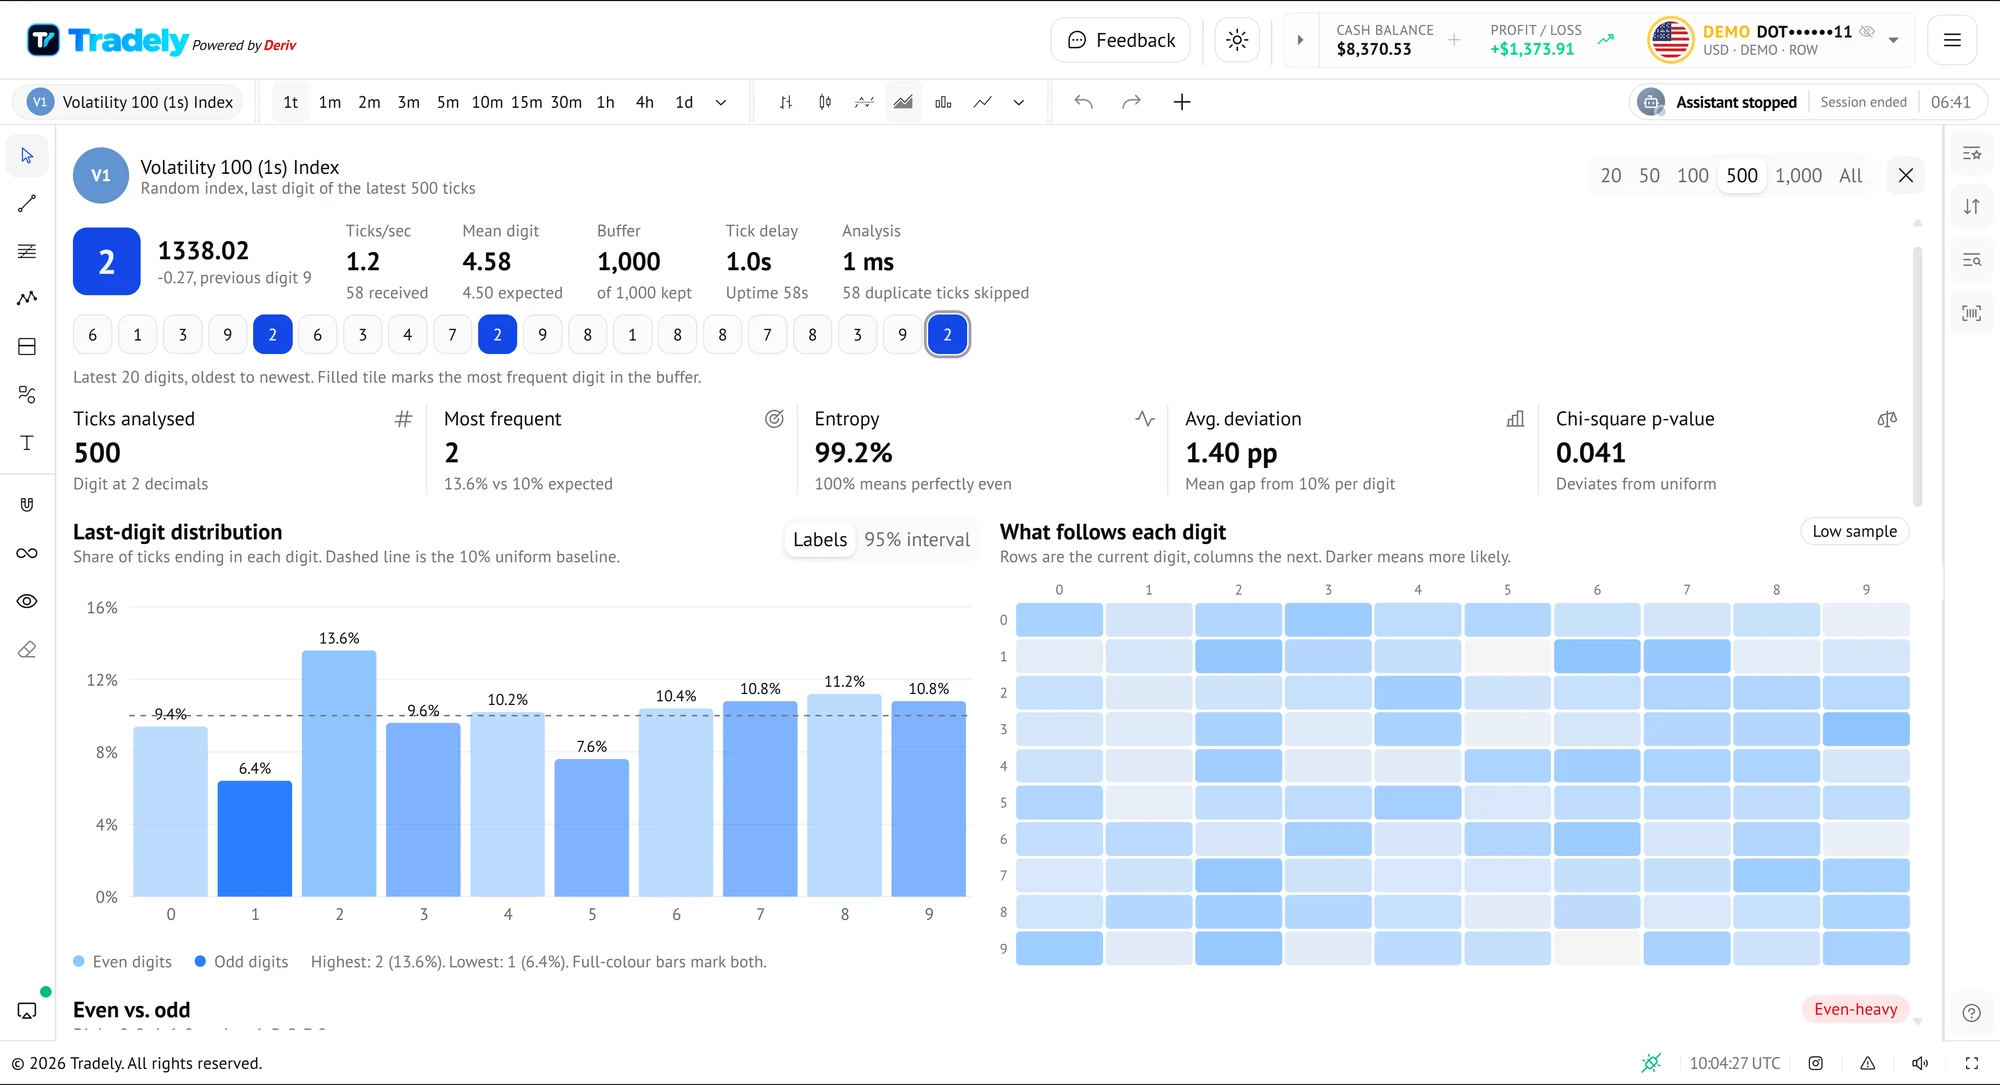
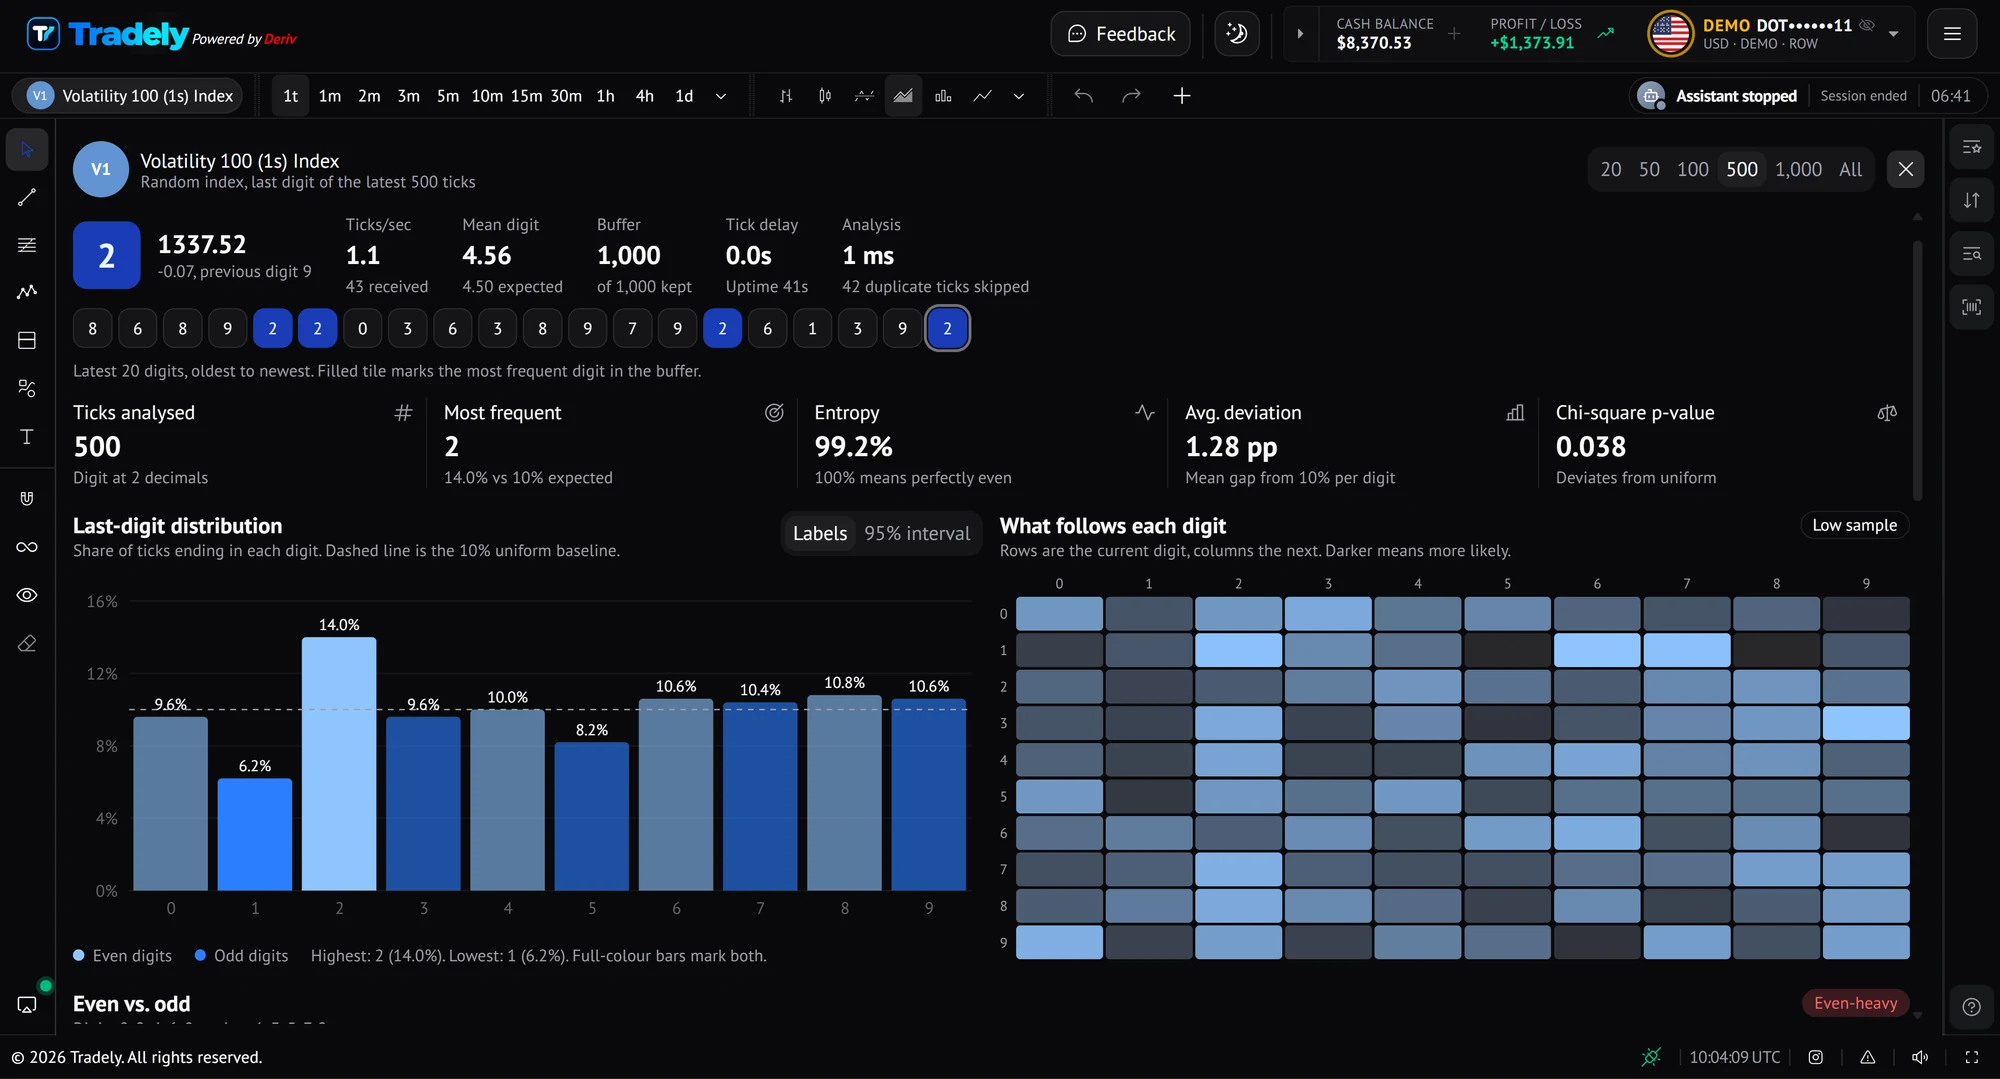
The app's Digit analysis shows how digits are distributed over the latest 20 to 1,000 ticks (or all of them). In the example, the most frequent digit was 5 at 11.8% against the expected 10%, and the panel reports the data as consistent with a uniform distribution (chi-square p-value 0.806, entropy 99.8%). That is what chance looks like: digits wobble around 10% without any digit being "due".
- Use it to see the distribution, not to predict the next digit.
- Small samples swing a lot. The panel flags a low sample.
- No staking strategy changes the odds of any single trade.
Practise on a Deriv demo account before you use real money.
Get StartedFrequently asked questions
- Which Digits contract is best?
- None is best. Each one trades off chance of winning against payout. Compare them on a demo account and review the results.
- Can Digit analysis predict the next digit?
- No. On random indices, the distribution shows what happened, not what comes next.
Keep reading
- Over/Under assistantOver/Under is a Digits contract: you predict whether the last digit of the final tick lands above or below a digit you choose. Tradely lets you automate it from one panel.
- Even/Odd assistantEven/Odd is the simplest Digits contract: predict whether the last digit of the final tick is even or odd. An assistant can repeat that decision for you under limits you set.
- Matches/Differs assistantMatches/Differs asks whether the last digit of the final tick equals a digit you choose. It is a Digits contract with very lopsided odds, so risk control matters.
Sources
Risk warning: Trading binary options involves a high level of risk and you could lose your entire stake. Only trade with money you can afford to lose. This page is educational and is not financial advice.